Data visualization
The last task of this tutorial shows you another advantage of Application Programming Interfaces: it is easy to reuse in different frameworks. Here, we show visualization of data with many HTML and JavaScript, using various libraries.
Browse the examples
Go to the following website and try the various examples. These JavaScript-enriched HTML pages use ambit.js and d3.js (mind you, these examples to not do justice to the features of d3.js!).
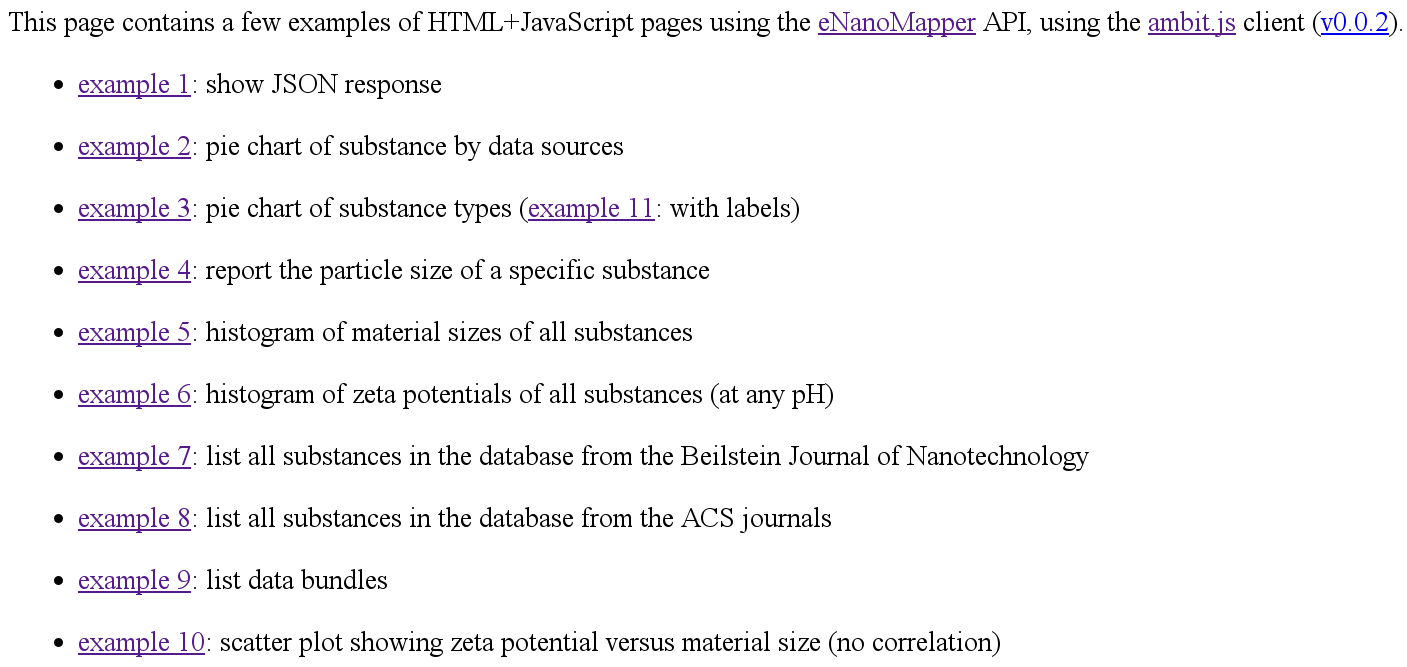
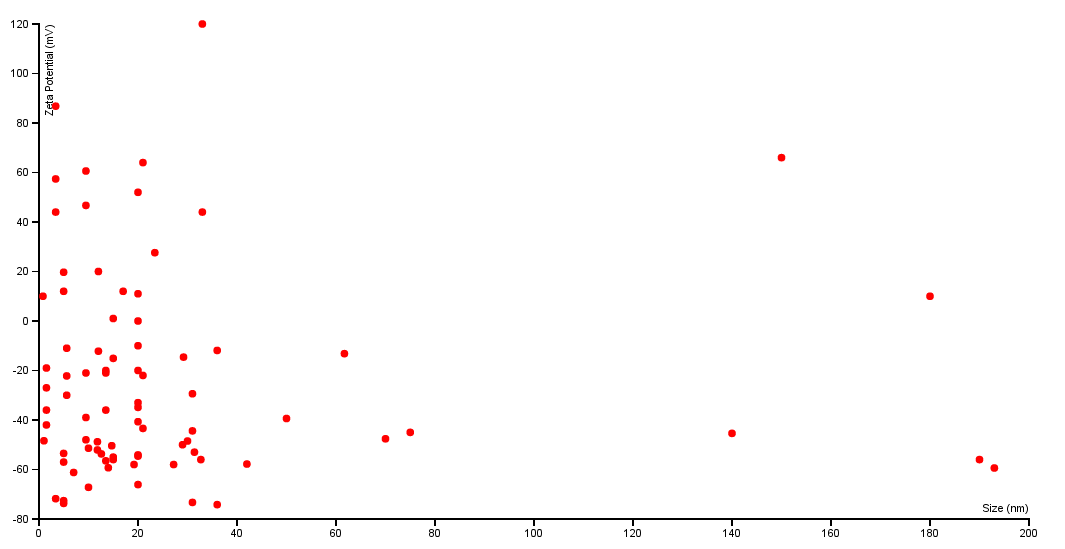
Particularly, check example 5, example 9, example 10, and example 11.
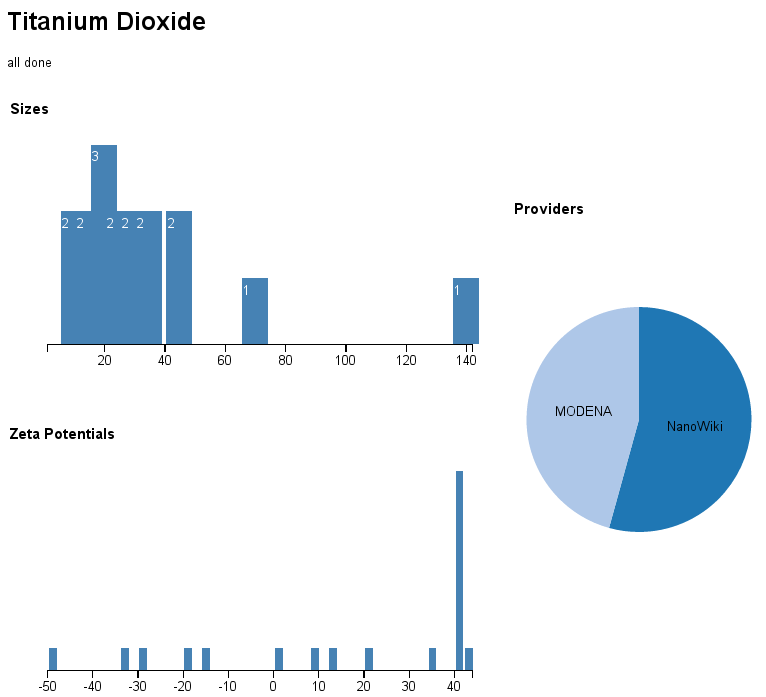
Titanium dioxide
Open this page to view a summary of titanium dioxides in data.enanomapper.net: http://enanomapper.github.io/ambit.js/titaniumoxide.html